
5 Things to Know About Singapore’s Urban Redevelopment and Landscape Changes
As one of the world's most densely populated cities, Singapore has undergone significant urban redevelopment over the past few decades...
Read More
TLDR
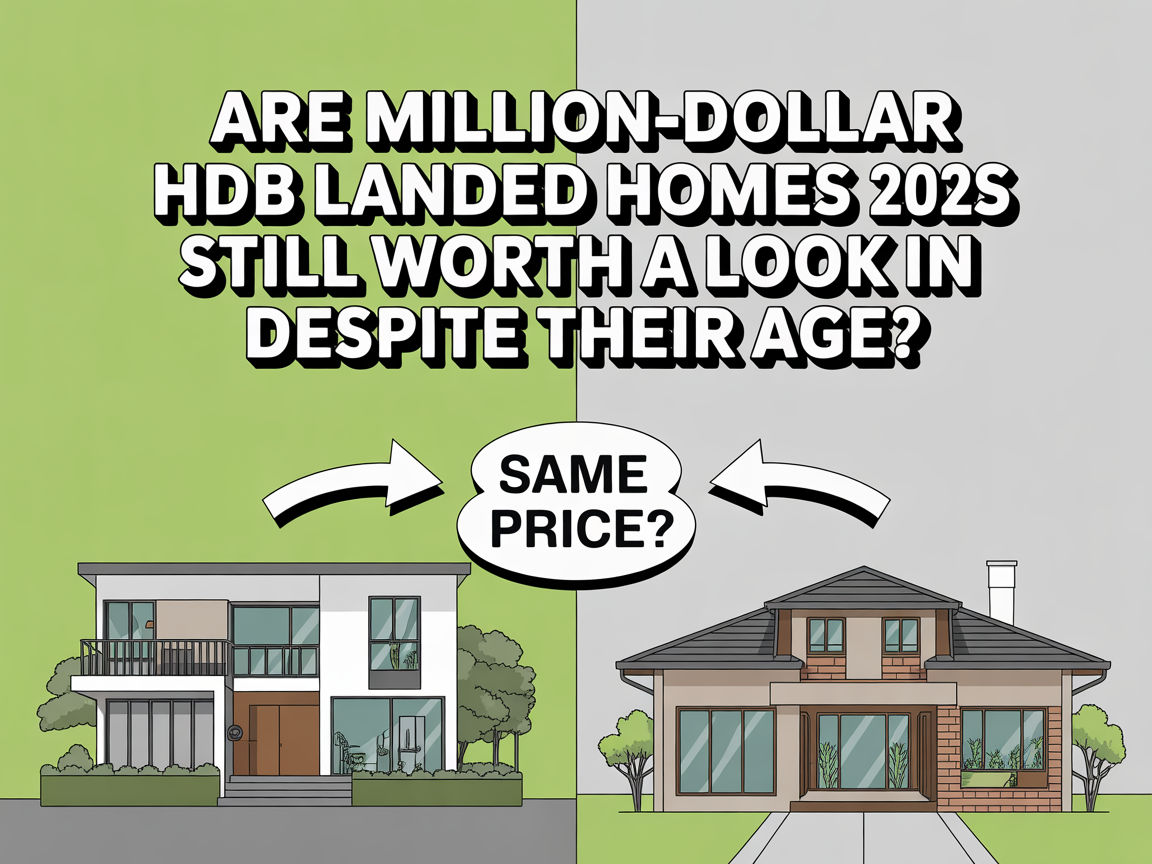
Old HDB landed homes, like those in Whampoa, are rare and now fetch over $1.5 million, but their value growth has slowed sharply compared to regular flats. Over the past decade (2014–2024), standard HDB flats—especially executive units—have outperformed these landed homes, mainly due to lease decay and stricter CPF rules that limit financing for older properties. While these houses offer unique lifestyle perks (land, space, privacy) at a lower entry cost than private landed, buyers should expect flat or minimal gains moving forward. HDB landed homes best suit those prioritizing lifestyle over profit, such as retirees or pet lovers, not investors seeking appreciation. For most buyers, younger executive flats now offer better value and flexibility. The market for old HDB terraces will face more headwinds as leases shorten and financing tightens.
The most budget-friendly landed homes in Singapore typically aren’t private properties; instead, they are HDB terraced units, many of which originate from the 1950s. Due to their rarity, they attract significant attention whenever one is sold – for instance, one of these 52-year-old HDB landed houses in Whampoa was sold for $1.568 million in July 2024. This technically makes it the priciest 3-room “flat” ever sold, although it may not be entirely fair to draw that comparison. Nevertheless, this raised questions about the resale value of these old landed houses, prompting us to investigate further:
We were able to identify 41 blocks with landed-type transactions from 1990 to the present. While this figure isn’t particularly high, it’s understandable since these properties are quite uncommon, leading to a lower transaction volume. Additionally, we couldn’t obtain the specific prices for these homes (as is the case with standard HDBs), but it provides some insight into the pricing trends.
| Year | JLN BAHAGIA | JLN MA’MOR | JLN TENTERAM | STIRLING RD |
| 1990 | $86,063 | $59,000 | $90,000 | $99,400 |
| 1991 | $90,409 | $70,000 | $60,000 | $100,800 |
| 1992 | $111,800 | $103,600 | $158,000 | |
| 1993 | $196,385 | $126,000 | $225,333 | |
| 1994 | $283,500 | $297,857 | $288,000 | $283,250 |
| 1995 | $398,500 | $372,143 | $398,700 | |
| 1996 | $498,350 | $445,769 | $430,000 | $498,286 |
| 1997 | $516,282 | $537,750 | $578,000 | $512,028 |
| 1998 | $459,150 | $463,000 | $474,125 | |
| 1999 | $426,677 | $452,989 | $430,000 | $460,000 |
| 2000 | $482,857 | $498,929 | $450,000 | $398,833 |
| 2001 | $476,000 | $468,333 | $469,000 | $426,000 |
| 2002 | $431,955 | $435,800 | $390,000 | $434,600 |
| 2003 | $420,250 | $397,667 | $390,000 | $410,200 |
| 2004 | $416,400 | $479,200 | $515,000 | $406,000 |
| 2005 | $444,429 | $368,333 | $368,000 | $394,800 |
| 2006 | $448,667 | $440,625 | $376,115 | |
| 2007 | $434,933 | $454,750 | $491,722 | |
| 2008 | $480,600 | $523,762 | $518,571 | |
| 2009 | $608,627 | $609,289 | $568,446 | |
| 2010 | $707,111 | $660,083 | $663,333 | $636,500 |
| 2011 | $759,875 | $768,000 | $769,400 | $740,296 |
| 2012 | $747,750 | $828,397 | $810,000 | $789,450 |
| 2013 | $730,000 | $933,222 | $818,250 | |
| 2014 | $800,750 | $880,750 | $704,000 | |
| 2015 | $837,948 | $842,667 | $794,333 | |
| 2016 | $764,722 | $843,750 | $915,000 | |
| 2017 | $771,000 | $806,481 | $844,630 | |
| 2018 | $878,000 | $810,333 | $645,000 | $873,000 |
| 2019 | $755,000 | $782,500 | $850,000 | |
| 2020 | $833,571 | $827,500 | $678,000 | $871,000 |
| 2021 | $973,320 | $907,500 | $965,000 | $864,000 |
| 2022 | $863,500 | $887,648 | $924,333 | |
| 2023 | $1,021,500 | $1,100,000 | $780,500 | |
| 2024 | $847,222 | $1,266,000 | ||
| Change (1990 – 2024) | 6.96% | 9.44% | 14.98% | 6.44% |
| Change (2014 – 2024) | 0.57% | 3.70% | No Data | 1.15% |
| Year | JLN BAHAGIA | JLN MA’MOR | JLN TENTERAM | STIRLING RD |
| 1990 | $74 | $41 | $89 | $90 |
| 1991 | $80 | $60 | $57 | $88 |
| 1992 | $83 | $69 | $122 | |
| 1993 | $128 | $113 | $189 | |
| 1994 | $247 | $222 | $185 | $279 |
| 1995 | $314 | $341 | $343 | |
| 1996 | $379 | $419 | $425 | $459 |
| 1997 | $400 | $353 | $303 | $477 |
| 1998 | $397 | $331 | $457 | |
| 1999 | $338 | $342 | $425 | $326 |
| 2000 | $429 | $351 | $431 | $396 |
| 2001 | $378 | $334 | $373 | $394 |
| 2002 | $352 | $384 | $385 | $349 |
| 2003 | $376 | $392 | $385 | $393 |
| 2004 | $347 | $298 | $216 | $342 |
| 2005 | $356 | $386 | $364 | $345 |
| 2006 | $309 | $352 | $364 | |
| 2007 | $380 | $395 | $423 | |
| 2008 | $507 | $400 | $503 | |
| 2009 | $507 | $450 | $513 | |
| 2010 | $544 | $607 | $567 | $617 |
| 2011 | $643 | $707 | $760 | $753 |
| 2012 | $822 | $703 | $801 | $818 |
| 2013 | $805 | $592 | $692 | |
| 2014 | $801 | $721 | $752 | |
| 2015 | $781 | $686 | $702 | |
| 2016 | $783 | $666 | $804 | |
| 2017 | $600 | $641 | $885 | |
| 2018 | $643 | $575 | $637 | $873 |
| 2019 | $702 | $806 | $908 | |
| 2020 | $726 | $725 | $670 | $774 |
| 2021 | $737 | $669 | $640 | $781 |
| 2022 | $915 | $867 | $742 | |
| 2023 | $784 | $955 | $783 | |
| 2024 | $762 | $590 | ||
| Change (1990 – 2024) | 7.11% | 8.14% | 12.31% | 6.78% |
| Change (2014 – 2024) | -0.51% | -1.98% | No Data | 0.45% |
Next, we will examine these landed home figures in relation to the performance of standard HDB flats:
| Year | 3 ROOM | 4 ROOM | 5 ROOM | EXECUTIVE |
| 1990 | $42,548 | $81,757 | $132,615 | $186,458 |
| 1991 | $44,390 | $81,761 | $138,103 | $191,167 |
| 1992 | $48,046 | $90,912 | $154,384 | $213,971 |
| 1993 | $70,767 | $134,360 | $227,253 | $296,455 |
| 1994 | $93,896 | $175,046 | $284,072 | $367,723 |
| 1995 | $120,862 | $216,575 | $341,553 | $443,288 |
| 1996 | $172,576 | $295,868 | $441,541 | $572,772 |
| 1997 | $194,325 | $304,947 | $442,182 | $567,156 |
| 1998 | $154,528 | $253,703 | $373,743 | $479,760 |
| 1999 | $145,733 | $243,871 | $355,042 | $447,643 |
| 2000 | $157,157 | $256,708 | $375,507 | $479,089 |
| 2001 | $144,927 | $233,871 | $340,184 | $445,524 |
| 2002 | $143,714 | $224,189 | $324,428 | $422,226 |
| 2003 | $159,283 | $230,091 | $322,054 | $408,603 |
| 2004 | $173,888 | $237,554 | $315,056 | $386,484 |
| 2005 | $170,063 | $234,454 | $303,456 | $361,812 |
| 2006 | $166,105 | $235,465 | $303,186 | $357,635 |
| 2007 | $180,589 | $254,522 | $327,557 | $384,763 |
| 2008 | $225,845 | $308,725 | $389,542 | $458,551 |
| 2009 | $248,522 | $331,749 | $403,023 | $471,082 |
| 2010 | $286,763 | $372,523 | $454,304 | $522,056 |
| 2011 | $324,178 | $422,694 | $501,826 | $577,826 |
| 2012 | $350,309 | $456,252 | $542,172 | $629,253 |
| 2013 | $361,126 | $479,144 | $568,800 | $661,300 |
| 2014 | $340,068 | $444,921 | $536,065 | $639,124 |
| 2015 | $323,645 | $433,574 | $515,018 | $620,677 |
| 2016 | $321,489 | $434,348 | $522,708 | $624,048 |
| 2017 | $316,668 | $437,120 | $532,277 | $627,211 |
| 2018 | $305,331 | $431,704 | $527,635 | $630,780 |
| 2019 | $298,230 | $429,749 | $526,812 | $617,561 |
| 2020 | $311,381 | $448,559 | $541,457 | $635,395 |
| 2021 | $351,378 | $505,022 | $603,990 | $705,559 |
| 2022 | $388,116 | $549,022 | $654,253 | $782,007 |
| 2023 | $411,272 | $584,035 | $685,338 | $829,310 |
| 2024 | $430,602 | $614,876 | $716,679 | $864,590 |
| Change (1990 – 2024) | 7.04% | 6.11% | 5.09% | 4.62% |
| Change (2014 – 2024) | 2.39% | 3.29% | 2.95% | 3.07% |
| Year | 3 ROOM | 4 ROOM | 5 ROOM | EXECUTIVE |
| 1990 | $58 | $80 | $100 | $116 |
| 1991 | $60 | $81 | $104 | $120 |
| 1992 | $65 | $90 | $116 | $134 |
| 1993 | $97 | $132 | $171 | $187 |
| 1994 | $128 | $170 | $214 | $232 |
| 1995 | $164 | $210 | $257 | $278 |
| 1996 | $234 | $284 | $332 | $359 |
| 1997 | $261 | $293 | $332 | $357 |
| 1998 | $209 | $243 | $279 | $301 |
| 1999 | $198 | $231 | $264 | $277 |
| 2000 | $213 | $242 | $279 | $298 |
| 2001 | $197 | $221 | $256 | $280 |
| 2002 | $195 | $212 | $245 | $266 |
| 2003 | $216 | $218 | $243 | $257 |
| 2004 | $238 | $227 | $240 | $244 |
| 2005 | $233 | $225 | $233 | $230 |
| 2006 | $228 | $227 | $235 | $227 |
| 2007 | $248 | $247 | $256 | $245 |
| 2008 | $310 | $299 | $306 | $293 |
| 2009 | $341 | $322 | $318 | $303 |
| 2010 | $394 | $361 | $356 | $335 |
| 2011 | $445 | $410 | $395 | $373 |
| 2012 | $482 | $443 | $426 | $409 |
| 2013 | $496 | $467 | $446 | $426 |
| 2014 | $465 | $434 | $421 | $412 |
| 2015 | $442 | $422 | $405 | $401 |
| 2016 | $439 | $423 | $411 | $402 |
| 2017 | $432 | $427 | $419 | $404 |
| 2018 | $417 | $422 | $416 | $406 |
| 2019 | $409 | $421 | $415 | $396 |
| 2020 | $427 | $443 | $430 | $407 |
| 2021 | $482 | $499 | $480 | $453 |
| 2022 | $532 | $541 | $519 | $499 |
| 2023 | $562 | $574 | $543 | $530 |
| 2024 | $589 | $606 | $568 | $553 |
| Change (1990 – 2024) | 7.07% | 6.13% | 5.25% | 4.69% |
| Change (2014 – 2024) | 2.41% | 3.39% | 3.05% | 2.97% |
Past decade’s data tells an unexpected tale. Regular HDB flats matched or beat terraced houses across all sizes from 2014 to 2024. Lease decay’s fingerprints show clearly here – many terraced homes hit their lease midlife crisis while younger flats powered ahead.
CPF rules changed the game in May 2019. Now, your CPF use depends on whether the remaining lease can carry you to age 95. For aging HDB terraced houses with sub-50-year leases, this hits hard. Looking ahead, these properties face a double squeeze: limited financing options and restricted CPF use. Cash buyers become rare birds, choking future price growth.
Enter executive flats – spacious alternatives to landed living. Historical data since 1990 favored HDB landed homes, but the last decade flips this script. Again, age matters. Even old executive flats rarely match the vintage of 1950s terrace houses.
Space hunters face a choice: aging landed charm versus younger executive practicality. Each path carries different trade-offs.
Real estate veterans share wisdom: HDB landed homes shine brightest for buyers who look past profit margins. Think retirees planning their forever home, gardening enthusiasts craving soil beneath their feet, or pet lovers needing extra space.
Compared to private landed prices, these homes offer similar lifestyle benefits at half the cost. But 2024 marks a turning point – future owners might need to accept minimal gains or even flat returns.
Want deeper insights into Singapore’s property scene? Follow us for market updates, or reach out for personalized property guidance.
If you’re reading this, you must be trying to figure out the best course of action right now: is it the right time to buy or sell?
It’s difficult to give an exact answer since everyone’s situation is unique and what works for one person may not necessarily work for you.
I can bring you a wealth of on-the-ground experience and a data-driven approach to provide clarity and direction. From beginners to experienced investors, our top-down, objective approach will help you on your real estate journey.
I can help you by:


You May Also Like …


A password will be e-mailed to you