TLDR
When considering the best time to buy or sell a property in Singapore, historical data analysis reveals key insights. Shorter holding periods, influenced by factors like the Total Debt Servicing Ratio (TDSR), can impact profits significantly. Sellers generally come out on top, but market conditions and regulations play crucial roles. With longer holding periods predicted ahead due to market dynamics, strategic real estate advice and understanding personal financial risks are essential for navigating the real estate market effectively.
The ever-present question in the real estate game, “When should I buy a property?” is closely followed by its sibling inquiry, “When’s the ideal time to sell my property?” Now, we’re tackling this puzzler, not with vague clichés like “A good time to buy a home was always five years ago,” but rather, taking a retrospective look at what past data could reveal.
We need to address these oft-repeated phrases. They embody a universal truth in the real estate sphere but fail to offer practical wisdom. The pursuit of the ‘perfect buying moment’ usually hits the wall of “we don’t have a magic 8-ball.” Yet, our approach this week begs to differ.
We dove into property market patterns from previous decades, aiming to identify the periods that historically gave buyers the upper hand. What did we uncover? The results might turn heads.
Maximizing Your Profits: Year of Purchase Impact on Gains!
| Year | Breakeven | Gain | Loss | Grand Total | Proportion Gained (%) |
| 1995 | 22 | 3,763 | 2,884 | 6669 | 56.4% |
| 1996 | 55 | 4,270 | 5,475 | 9800 | 43.6% |
| 1997 | 25 | 3,089 | 3,026 | 6,140 | 50.3% |
| 1998 | 20 | 4,547 | 1,735 | 6,302 | 72.2% |
| 1999 | 32 | 7,639 | 2,826 | 10,497 | 72.8% |
| 2000 | 9 | 3,625 | 1,462 | 5,096 | 71.1% |
| 2001 | 9 | 4,482 | 1,124 | 5,615 | 79.8% |
| 2002 | 23 | 7,687 | 1,252 | 8,962 | 85.8% |
| 2003 | 10 | 4,598 | 297 | 4,905 | 93.7% |
| 2004 | 2 | 5,175 | 144 | 5,321 | 97.3% |
| 2005 | 1 | 8,068 | 71 | 8,140 | 99.1% |
| 2006 | 3 | 11,600 | 214 | 11,817 | 98.2% |
| 2007 | 41 | 18,782 | 2,324 | 21,147 | 88.8% |
| 2008 | 10 | 6,338 | 325 | 6,673 | 95.0% |
| 2009 | 5 | 14,606 | 238 | 14,849 | 98.4% |
| 2010 | 40 | 14,440 | 1,016 | 15,496 | 93.2% |
| 2011 | 62 | 9,974 | 1,817 | 11,853 | 84.1% |
| 2012 | 80 | 9,493 | 2,247 | 11,820 | 80.3% |
| 2013 | 34 | 5,350 | 1,548 | 6,932 | 77.2% |
| 2014 | 23 | 2,536 | 476 | 3,035 | 83.6% |
| 2015 | 16 | 3,146 | 246 | 3,408 | 92.3% |
| 2016 | 20 | 3,110 | 172 | 3,302 | 94.2% |
| 2017 | 8 | 3,689 | 157 | 3,854 | 95.7% |
| 2018 | 7 | 2,218 | 142 | 2,367 | 93.7% |
| 2019 | 1,589 | 34 | 1,623 | 97.9% | |
| 2020 | 1 | 656 | 8 | 665 | 98.6% |
| 2021 | 134 | 7 | 141 | 95.0% | |
| 2022 | 9 | 1 | 10 | 90.0% | |
| 2023 | 3 | 2 | 1 | 6 | 33.3% |
Source: URA.
Peering into the findings noted above, it’s apparent that:
1. The least gains were recorded during the briefest holding period, which was in 2020.
2. With remarkable agility, the market adjusted to the TDSR.
3. Surprisingly, the height of the cooling measure actually occurred back in 1996.
4. Generally, sellers end up on top, regardless of when they make a deal.
Unveiling the Shortest Hold Yet: 2020’s Record Low
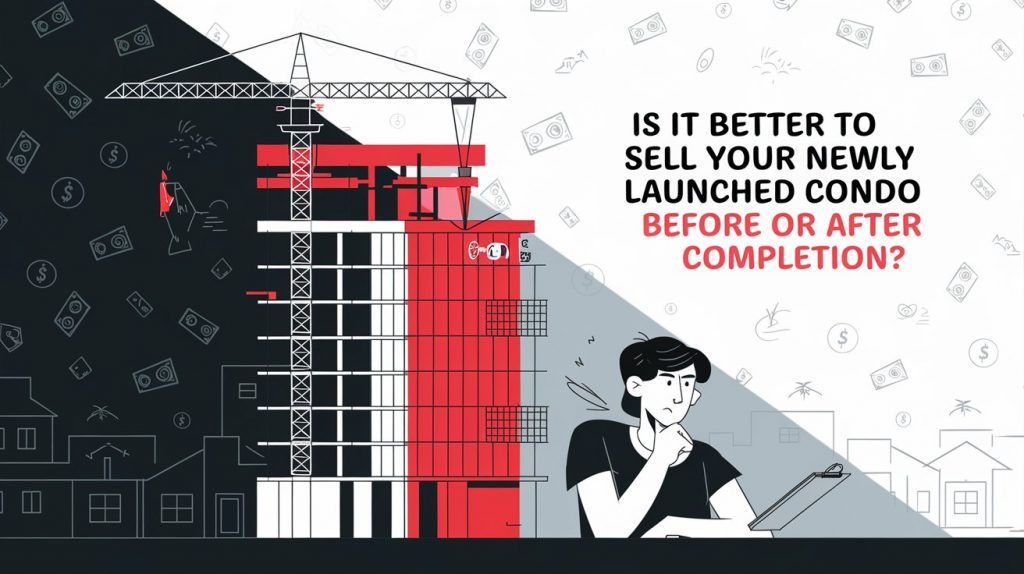
This trend appears to be driven by sellers eager to capitalize on quick profits, engaging in sub-sale transactions. If you were fortunate enough to snag a unit at an early bird discount during the launch, it could be worth considering selling it even prior to the Temporary Occupation Permit (TOP), especially if the current price is higher. Let’s illustrate this with a practical example:
Suppose you invested in Ki Residences right at its launch in December 2020, your acquisition cost might have been roughly $1,766 per square foot. Fast forward to September 2022, and the median price had escalated to $2,133 per square foot. By October 2023, it had further appreciated to approximately $2,251 per square foot.
As one of the earliest investors, you could have potentially sold your property during the aforementioned periods (’22 or ’23) to realize profits even before the condominium project was fully completed. Your profit margin may not match that of someone who held onto their investment for a decade or more, but the quicker return compensates for this.
This observation seems to affirm the adage that shorter holding periods often yield lesser profits. However, it’s important to note that this isn’t necessarily a negative. Cashing in on your gains earlier could set you up for an immediate upgrade.
Rapid Adaptation of the Market to TDSR!
Introduced back in 2013, the Total Debt Servicing Ratio (TDSR) put a cap on monthly loan repayments — along with other existing debts — to 60 percent of your monthly earnings. However, fast forward to 2023, and this cap has been reduced to 55 percent.
When TDSR first hit the scene, it made quite a splash. We saw gains drop from around 80 and 84 percent to a mere 77.2 percent. It’s clear that this new rule pushed sellers to knock down their prices a bit to make sure buyers could secure the necessary funds.
But, like most things, this impact didn’t last long. In fact, by the next year, sellers were already starting to see their profits climb back up.
The Most Impactful Cooling Initiative: Unveiling the 1996 Breakthrough!
Believe the most extreme cooling measures happened in 2011 with ABSD? Not even close. They’re practically insignificant when you stack them against 1996, a year when a whole array of cooling strategies were put into action all at once.
Just look at the numbers: in ’96, we had a total of 5,475 transactions ending up in losses, as opposed to 4,270 that turned a profit. That year stands out as one of the rare instances in Singapore’s real estate history when those who invested in properties ended up seeing more red than green. Then came 1997 and the Asian Financial Crisis, which threw a further spanner in the works, resulting in almost an equal number of gains (3,089) and losses (3,026).
Considering this period has been tagged as one of the toughest times to invest in property, it’s worth studying the figures more closely to understand the full picture.
| Holding Period (Years) | |||
| Year Bought | Breakeven | Gain | Loss |
| 1995 | 6.4 | 10.5 | 7.6 |
| 1996 | 6.2 | 13.7 | 7.2 |
| 1997 | 9.0 | 15.2 | 7.4 |
If you managed to snag a property between ’95 and ’97, you didn’t have to wait too long before seeing your investment break even. Making a profit or loss? Well, that took a bit longer. In fact, on average, you were looking at holding onto your place for over 10 years before any real gains popped up.
But since the time you hang onto a property can seriously make or break profits, let’s dive a little deeper into that:
| Year Bought | Held > 3 Years | Held < 3 Years | Grand Total | % Held < 3 Years & Lost Money |
| 1995 | 5,145 | 1,477 | 6,622 | |
| Breakeven | 16 | 3 | 19 | |
| Gain | 2,484 | 1,264 | 3,748 | |
| Loss | 2,645 | 210 | 2,855 | 14.2% |
| 1996 | 7,984 | 1,635 | 9,619 | |
| Breakeven | 28 | 15 | 43 | |
| Gain | 3,501 | 753 | 4,254 | |
| Loss | 4,455 | 867 | 5,322 | 53.0% |
| 1997 | 5,451 | 628 | 6,079 | |
| Breakeven | 17 | 6 | 23 | |
| Gain | 2,922 | 158 | 3,080 | |
| Loss | 2,512 | 464 | 2,976 | 73.9% |
Back in ’95, about 14.2% of short-term investments (held for less than 3 years) ended up in the red. Fast forward to ’96 and ’97, these figures shot up dramatically to 53% and nearly 74% respectively.
In simple terms, if you had bought in ’95 and sold within 3 years, you’d have a 14.2% chance of losing cash. However, things got really dicey if you jumped in during ’96. In this case, more than half of those who sold within 3 years would’ve suffered financial loss. The situation worsened in ’97 with nearly three-quarters of investors facing losses if they sold within the same timeframe.
This trend is closely linked with the property cycle, with ’98 marking a low point. It took until around 2006/07 for the market to truly bounce back.
| Quantum Gains/Loss | ||
| Year Bought | Gain | Loss |
| 1995 | $312,385 | -$197,079 |
| 1996 | $333,801 | -$265,001 |
| 1997 | $303,910 | -$237,176 |
To put it simply, the overall profits tend to outweigh the losses, especially considering the typical holding period of over a decade. That’s quite some time!
However, if we look back, we’ll notice that sellers haven’t had to face such challenging circumstances again. Yet, it’s worth remembering that these situations have occurred in the past and there’s a possibility they might crop up again. So, even if your holding period is lengthy, there’s always the chance of running into some bad luck. You could be forced to sell following stringent regulatory measures or amid a broader market slump. Let’s just hope such an unfortunate event doesn’t coincide with your plans to downgrade for retirement!
Winning: The Seller’s Success Story in Every Transaction
Singapore’s real estate investors are indeed fortunate, given the stability of our market. Generally speaking, the odds favor an annual increase in property value over a decrease, with a few notable exceptions like the years ’96 and ’97.
Therefore, it’s more important for us to manage potential risks linked to our personal finances rather than fretting excessively about market trends.
Expect Longer Holding Periods Ahead: What Lies in the Future?
Real estate professionals are voicing concerns over a lack of properties on the market, as Singaporeans seem more reluctant to sell. The common thread in their grievances appears to be the high cost of alternative properties.
Many believe that the swift surge of home prices in the aftermath of the pandemic, propelled by an acute housing shortage, is to blame. One agent pointed out a misguided prediction from experts in 2019, who forecasted an oversupply risk, when the reality proved starkly different.
Highlighting the current state of affairs, an agent mentioned that the price of newly launched three-bedroom condos has escalated beyond $2 million, and resale units aren’t far behind, crossing the $1.8 million threshold. She poses the question: “If you cash in your $600,000 flat today, what options are available that fit both your budget and your family’s needs?” It seems buyers have already determined that it falls short, but sellers, influenced by the last few years, maintain unrealistic expectations.
However, the lack of buyer enthusiasm or buying power doesn’t appear to impact property prices. Actions like the tightening of the TDSR have ensured that most homeowners are financially stable and don’t feel any rush to sell.
Adding to the complexity, the government has enforced a 15-month waiting period for individuals wanting to purchase a resale flat after selling a private property. This is accompanied by changes to the Prime Location Housing model, which now includes a 10-year MOP instead of the previous 5 years. These factors, combined with high seller expectations, could lead to a decrease in resale transactions and longer holding periods.
Should You Buy, Sell or Wait?
If you’re reading this, you must be trying to figure out the best course of action right now: is it the right time to buy or sell?
It’s difficult to give an exact answer since everyone’s situation is unique and what works for one person may not necessarily work for you.
I can bring you a wealth of on-the-ground experience and a data-driven approach to provide clarity and direction. From beginners to experienced investors, our top-down, objective approach will help you on your real estate journey.
I can help you by:
- Offering Strategic Real Estate Advice – I can help create a comprehensive plan to guide you through your property journey.
- Connecting Your Home with the Perfect Buyers – Through stunning visuals, an effective communication strategy, and an in-depth knowledge of the market, we’ll ensure your home is presented in the best possible way to fulfill your goals.
You May Also Like …


